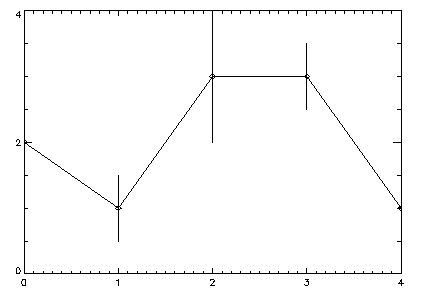
 (optional) A real vector containing the x-coordinates of the data to plot. If not present, x is assumed to be a vector of the same size as y and to have integer values beginning at 0 and continuing to the size of y - 1.
y
 A real vector containing the y-coordinates of the data to plot.
 error
 A vector containing the error bar values of every point to be plotted.


