 A 2D array giving the field vector at each point along the x-axis.
v
 A 2D array giving the field vector at each point along the y-axis.
Standard Library procedure that plots a two-dimensional velocity field.
 A 2D array giving the field vector at each point along the x-axis.
v
 A 2D array giving the field vector at each point along the y-axis.
 The aspect ratio of the final plot; that is, the ratio of the length of x-axis to the length of the y-axis. (Default: 1)
Length
 The length of the longest field vector, expressed as a fraction of the plotting area. (Default: 0.1)
N
 The number of arrows to draw. (Default: 200)
Title
 A string containing the title of the plot. The default title is "Velocity Field".
CAUTION: Extra care must be taken if you run the PLOT_FIELD and VEL procedures in the same PV-WAVE session. Each procedure calls a routine named ARROWS, but the ARROWS routines are slightly different. If you get an error in the ARROWS routine when you are using PLOT_FIELD, recompile PLOT_FIELD (by typing.run PLOT_FIELD), and then try again.
u = FLTARR(21, 21)
v = FLTARR(21, 21)
.RUN
 will change to a dash (-)
; to indicate that you may enter a complete program unit.
FOR j = 0, 20 DO BEGIN
FOR i = 0, 20 DO BEGIN
x = 0.05 * FLOAT(i)
z = 0.05 * FLOAT(j)
u(i, j) = -SIN(!Pi * x) * COS(!Pi * z)
v(i, j) =  COS(!Pi * x) * SIN(!Pi * z)
ENDFOR
ENDFOR
END
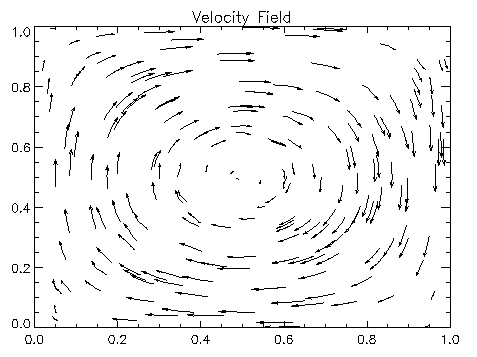
PLOT_FIELD, u, v, Title = 'Velocity Field'
Figure 2-73 Velocity field displayed with default values.

Figure 2-74 Velocity field displayed with default values.
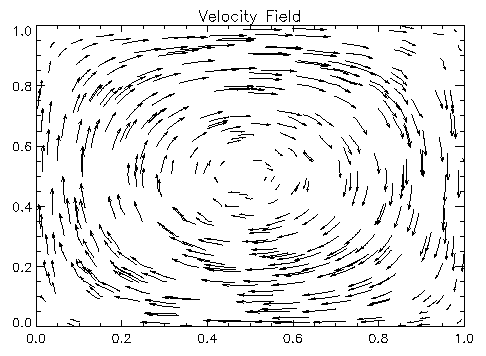
PLOT_FIELD, u, v, N = 400, Title = 'Velocity Field'
Figure 2-75 Velocity field displayed with 400 arrows.

Figure 2-76 Velocity field displayed with 400 arrows.
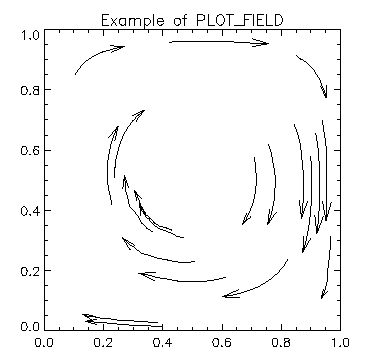
PLOT_FIELD, u, v, Aspect = .7, Length = .4,$
    N = 20, Title = 'Example of PLOT_FIELD'
Figure 2-77 Velocity field modified with various keywords.

Figure 2-78 Velocity field modified with various keywords.


