ERRPLOT Procedure
Standard Library procedure that overplots
error bars over a previously-drawn plot.
Usage
Input Parameters
Keywords
Discussion
Example
y = [4.0, 5.0, 3.0, 3.0, 2.0]
err = 0.2
PLOT, y, YRange=[1, 6]
ERRPLOT, y-err, y+err
low = [3.5, 4.8, 2.5, 2.7, 1.9]
high = [4.3, 5.1, 3.5, 3.2, 2.1]
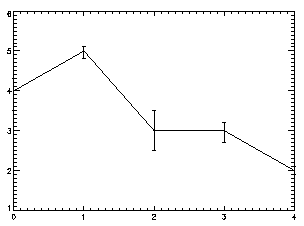
PLOT, y, YRange=[1, 6]
ERRPLOT, low, high
Figure 2-35 In this example, asymmetrical error estimates have been constrained by using ERRPLOT's low and high parameters.
Figure 2-36 In this example, asymmetrical error estimates have been constrained by using ERRPLOT's low and high parameters.
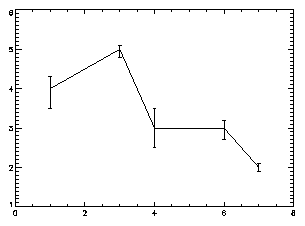
points = [1.0, 3.0, 4.0, 6.0, 7.0]
PLOT, points, y, YRange=[1, 6]
ERRPLOT, points, low, high
Figure 2-37 In this example, error bars have been plotted over a vector containing specific points along the x-axis.
Figure 2-38 In this example, error bars have been plotted over a vector containing specific points along the x-axis.
See Also


doc@boulder.vni.com
Copyright © 1999, Visual Numerics, Inc. All rights
reserved.
 (optional) A vector containing the independent or abscissae values of the function. If points is omitted, the abscissae values are taken to be unit distances along the x-axis, beginning with 0.
 A vector containing the lower bounds of the error bars. The value of low(i) is equal to the data value at i minus the lower error bound.
 A vector containing the upper bounds of the error bars. The value of high(i) is equal to the data value at i plus the upper error bound.


