 A vector. If only one parameter is supplied, x is plotted on the y-axis as a function of point number.
y
 (optional) A vector. If two parameters are supplied, y is plotted as a function of x.
Plots vectordata over a previously drawn plot.
 A vector. If only one parameter is supplied, x is plotted on the y-axis as a function of point number.
y
 (optional) A vector. If two parameters are supplied, y is plotted as a function of x.
RANDOMOPT, Set = 45321
; Create a vector of 10 random values.
x = RANDOM (10)
PLOT, x, Psym = 6
; Plot the random points as a function of vector index. Use square
; marker symbols to represent the data points.
pp = CSINTERP(FINDGEN(10), x)
ppval = SPVALUE(FINDGEN(100)/10, pp)
; Compute the cubic spline interpolant.
OPLOT, FINDGEN(100)/10, ppval
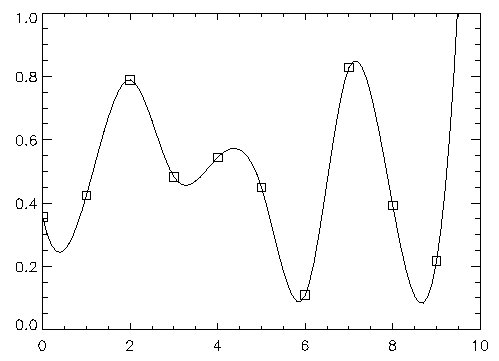
; Plot the interpolant over the marker symbols (see Figure 2-57).
Figure 2-57 Overplotting a plot.

Figure 2-58 Overplotting a plot.
For more information, see Chapter 4, Displaying 2D Data, in the PV-WAVE User's Guide.


