 The x-component of the velocity field at each point. This parameter must be a two-dimensional array.
v
 The y-component of the velocity field at each point. This parameter must have the same dimensions as u.
Standard Library procedure that draws a graph of a velocityfield with arrows pointing in the direction of the field. The length of an arrow is proportional to the strength of the field at that point.
 The x-component of the velocity field at each point. This parameter must be a two-dimensional array.
v
 The y-component of the velocity field at each point. This parameter must have the same dimensions as u.
 The length of each arrow segment, expressed as a fraction of the longest arrow divided by Nsteps. Length is used to calculate the proportional length of each arrow segment. (Default: 0.1)
Nsteps
 The number of segments in each arrow. (Default: 10)
Nvecs
 The number of arrows to draw. (Default: 200)
Xmax
 The aspect ratio (the x-axis size as a fraction of the y-axis size). (Default: 1.0)
The field is recalculated at the endpoint of this vector and a new vector is iteratively drawn, until an arrow with Nsteps number of segments is drawn.
An arrowhead is drawn at the end of this arrow, and the procedure moves on to another random point to initiate the loop again. The graph is plotted with the title "Velocity Field".
CAUTION: Extra care must be taken if you run the PLOT_FIELD and VEL procedures in the same PV-WAVE session. Each procedure calls a routine named ARROWS, but the ARROWS routines are slightly different. If you get an error in the ARROWS routine when you are using VEL, recompile VEL (by typing.RUN VEL), and then try again.
u = FLTARR(21, 21)
v = FLTARR(21, 21)
.RUN
FOR j = 0, 20 DO BEGIN
FOR i = 0, 20 DO BEGIN
x = 0.05 * FLOAT(i)
z = 0.05 * FLOAT(j)
u(i, j) = -SIN(!Pi*x) * COS(!Pi*z)
v(i, j) = COS(!Pi*x) * SIN(!Pi*z)
ENDFOR
ENDFOR
END
 prompt.
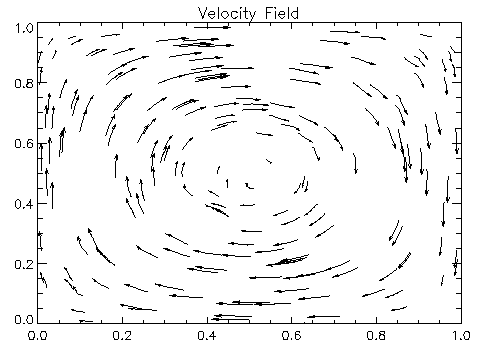
VEL, u, v
Figure 2-129 Velocity field displayed with default values.

Figure 2-130 Velocity field displayed with default values.
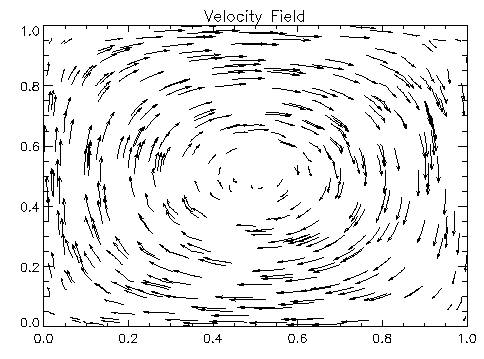
VEL, u, v, Nvecs=400
Figure 2-131 Velocity field displayed with 400 arrows.

Figure 2-132 Velocity field displayed with 400 arrows.
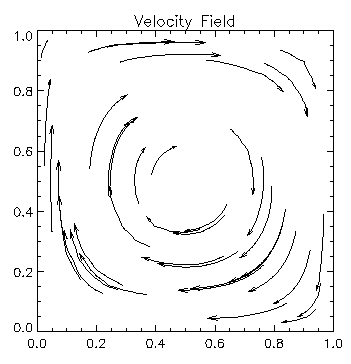
VEL, u, v, Nvecs=40, Xmax=.7, Length=.4, Nsteps=20
Figure 2-133 Velocity field displayed using various keywords.

Figure 2-134 Velocity field displayed using various keywords.


