USERSYM Procedure
Lets you create a custom symbol
for marking plotted points.
Usage
Input Parameters
x, y  Vectors containing the x and y vertices of the symbol to be created. In the case of vector-drawn symbols, these vertices are connected, in order, with vectors forming the symbol.
If only x is specified, it must be a (2, n) array of vertices, with element (0, i) containing the x-coordinate of the vertex, and element (1, i) containing the y-coordinate.
Keywords
Discussion
Example
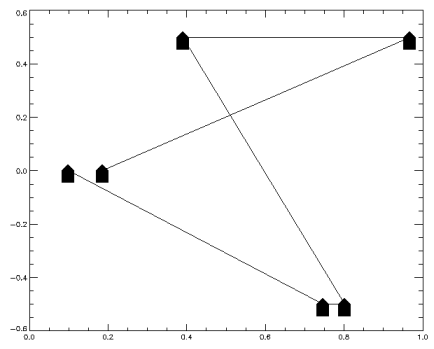
x = [0, -0.5, -0.5, 0.5, 0.5, 0]
y = [0.5, 0, -1, -1, 0, 0.5]
USERSYM, x, y, /Fill
RANDOMOPT, Set = 12542
pts = RANDOM(6)
PLOT, pts, Psym = -8, Symsize = 6, $
    X
Range = [-0.1, 5.1]
Figure 2-127 Scattered data plot with user-defined markers for data points.
Figure 2-128 Scattered data plot with user-defined markers for data points.
See Also


doc@boulder.vni.com
Copyright © 1999, Visual Numerics, Inc. All rights
reserved.
 Vectors containing the x and y vertices of the symbol to be created. In the case of vector-drawn symbols, these vertices are connected, in order, with vectors forming the symbol.


