PLOTS Procedure
Plots
vectors or points on the current graphics device in either two or three dimensions.
Usage
Input Parameters
x  A vector parameter providing the x-coordinates of the points to be connected.
If only one parameter is specified, x must be an array of either two or three vectors: (2,*) or (3,*). In this special case, x(0,*) is taken as the x values, x(1,*) is taken as the y values, and x(2,*) is taken as the z values.
y  (optional) A vector parameter providing the y-coordinates of the points to be connected.
z  (optional) If present, a vector parameter providing the z-coordinates of the points to be connected. If z is not specified, x and y are used to draw lines in two dimensions. z has no effect if the keyword T3d is not specified and the system variable !P.T3d = 0.
Keywords
Discussion
Example 1
WINDOW
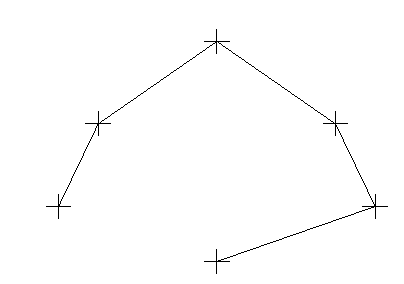
xdata = [.1, .2, .5, .8, .9, .5]
ydata = [.3, .6, .9, .6, .3, .1]
PLOTS, xdata, ydata
PLOTS, xdata, ydata, /Normal
PLOTS, xdata, ydata, Symsize=5.0, Psym=-1,$
    /Normal
Figure 2-79 Connected lines drawn with PLOTS.
Figure 2-80 Connected lines drawn with PLOTS.
Example 2
PLOT, FINDGEN(2), /Nodata, $
    XRange = [-1, 1], YRange = [-1, 1]
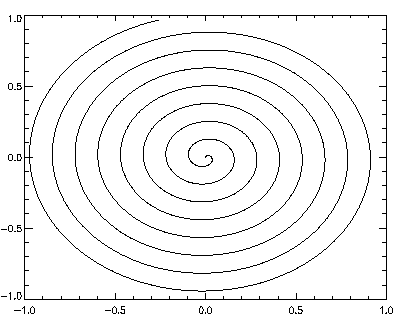
p = FINDGEN(1000)/999
x = p * SIN(50 * p)
y = p * COS(50 * p)
PLOTS, x, y
Figure 2-81 Plot of curve in R2 using PLOTS.
Figure 2-82 Plot of curve in R2 using PLOTS.
Example 3
SURFACE, FINDGEN(2, 2), /Nodata, /Save, $
    XRange = [-1, 1], YRange = [-1, 1], $
    ZRange = [0, 1]
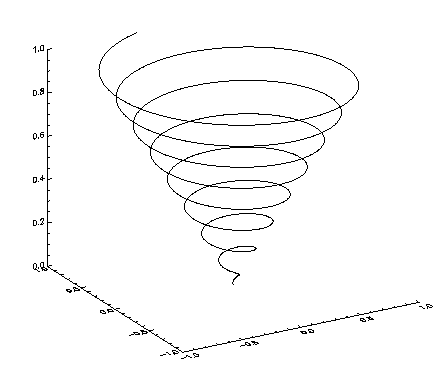
z = FINDGEN(1000)/999
x = z * SIN(50 * z)
y = z * COS(50 * z)
PLOTS, x, y, z, /T3d
Figure 2-83 Line plot in R3.
Figure 2-84 Line plot in IR3.
See Also


doc@boulder.vni.com
Copyright © 1999, Visual Numerics, Inc. All rights
reserved.
 A vector parameter providing the x-coordinates of the points to be connected.
 (optional) A vector parameter providing the y-coordinates of the points to be connected.
 (optional) If present, a vector parameter providing the z-coordinates of the points to be connected. If z is not specified, x and y are used to draw lines in two dimensions. z has no effect if the keyword T3d is not specified and the system variable !P.T3d = 0.


