WgStripTool Procedure
Creates a window that displays data in a style that simulates a real-time, moving strip chart.
Usage
WgStripTool [, x, y1, y2, ..., y10, parent [, shell ]]
WgStripTool [, x [, y1 [, y2 [, y3 [, y4 [, y5 [, y6 [, y7 [, y8 [, y9 [, y10 ]]]]]]]]]]]
Input Parameters
Output Parameters
Keywords
Color/Font Keywords
Discussion
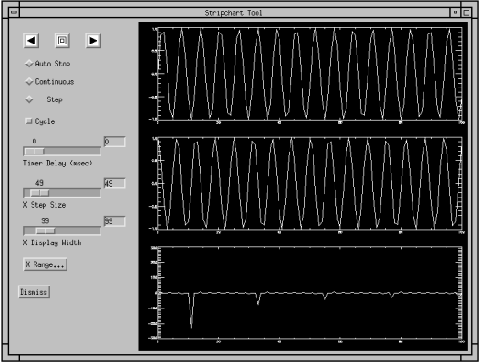
The WgStripTool window (Figure 2-163) allows you to view data in moving strip charts; you can adjust the display width in the strip charts to create the effect of zooming in and out. You can also adjust the rate and the manner with which the strip charts progress through the data.
Figure 2-163 The WgStripTool window lets you interactively view data in moving strip charts; up to ten strip charts can be simultaneously displayed by the WgStripTool window. You can adjust the display width in the strip charts to create the effect of zooming in and out. You can also adjust the rate and the manner with which the strip charts progress through the data.
Figure 2-164 The WgStripTool window lets you interactively view data in moving strip charts; up to ten strip charts can be simultaneously displayed by the WgStripTool window. You can adjust the display width in the strip charts to create the effect of zooming in and out. You can also adjust the rate and the manner with which the strip charts progress through the data.
Event Handling
Contents of the Window
StripTool Display Area
StripTool Control Area
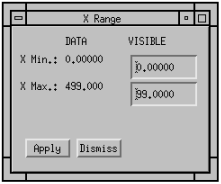
Figure 2-165 Use this dialog box to precisely control the range of the x-axis in the WgStripTool window. This dialog box is displayed if you click the X Range button in the WgStripTool control area.
Figure 2-166 Use this dialog box to precisely control the range of the x-axis in the WgStripTool window. This dialog box is displayed if you click the X Range button in the WgStripTool control area.
Example
PRO Sample_wgstriptool, parent, tool_shell
x = indgen(500)
y1 = sin(x)
y2 = cos(x)
y3 = tan(x)
IF N_ELEMENTS(parent) NE 0 THEN BEGIN
WgStripTool, x, y1, y2, y3, $
    0, 0, 0, 0, 0, 0, 0, parent, tool_shell
ENDIF ELSE BEGIN
WgStripTool, x, y1, y2, y3
ENDELSE
END
See Also


doc@boulder.vni.com
Copyright © 1999, Visual Numerics, Inc. All rights
reserved.
 (optional) A vector specifying the x values (horizontal) of each strip chart. If not specified, or set equal to zero, monotonically increasing values, starting with 0 (zero) are automatically provided along the x-axis. Must have the same number of elements as the y vectors.
 (optional) Up to ten vectors containing data in the y direction (vertical); each vector is displayed in a separate strip chart. The number of y variables specified determines the number of strip charts that are displayed. All y vectors should contain the same number of elements.
 (optional) The widget or shell ID of the parent widget (long). If parent is not specified, WgStripTool runs on its own (i.e., in its own event loop).
 prompt


