 The two-dimensional array to display.
Standard Library procedure thatoverlays a contour plot onto an image display of the same array.
 The two-dimensional array to display.
 Set to 1 to change the image's aspect ratio. It assumes square pixels. If Aspect is not set, the aspect ratio is retained.
Interp
 Set to 1 to interpolate the image with the bilinear method, when and if the image is resampled. Otherwise, the nearest neighbor method is used.
Window_Scale
 Set to 1 to scale the window size to the image size. Otherwise, the image size is scaled to the window size. Window_Scale is ignored when outputting to devices with scalable pixels (e.g., PostScript devices).
 {R2 | x, y
  [-10, 10]}
.RUN
FUNCTION f, x, y
RETURN, x * SIN(y) + y * COS(x) - 10 * SIN(0.25 * x * y)
END
x = FINDGEN(101)/5 - 10
; Create vector of x-coordinates.
y = x
; Create vector of y-coordinates.
z = FLTARR(101, 101)
; Create an array to hold the function values.
FOR i = 0, 100 DO FOR j = 0, 100 DO $
    z(i, j) = f(x(i), y(j))
z.
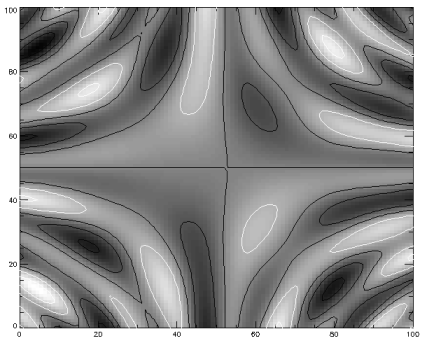
IMAGE_CONT, z
; Display image and contour plot.
Figure 2-51 Image and contour plot of (x,y) = xsin(y) + ycos(x) - 10sin(xy/4)

Figure 2-52 Image and contour plot of.
For details on methods of interpolation, see the PV-WAVE User's Guide.


