 A 2D array containing the values that make up the contour surface.
 x
 (optional) A vector or 2D array specifying the x-coordinates for the contour surface.
 y
 (optional) A vector or 2D array specifying the y-coordinates for the contour surface.
Draws acontour plot from data stored in a rectangular array.
 A 2D array containing the values that make up the contour surface.
 x
 (optional) A vector or 2D array specifying the x-coordinates for the contour surface.
 y
 (optional) A vector or 2D array specifying the y-coordinates for the contour surface.
If x is a vector, each element of x specifies the x-coordinate for a column of z. For example,
X(0) specifies the x-coordinate for Z(0, *). If the x parameter is a 2D array, each element of x specifies the x-coordinate of the corresponding point in z (xij specifies the x-coordinate for zij). If y is a vector, each element of y specifies the y-coordinate for a row of z. If the y parameter is a 2D array, each element of y specifies the y-coordinate of the corresponding point in z (yij specifies the y-coordinate for zij).
CONTOUR draws contours using one of two different methods:
RANDOMOPT, Set = 1257
z = REFORM(RANDOM(36), 6, 6)
CONTOUR, z, /Spline,  $
    Levels = [0.2, 0.4, 0.6, 0.8],  $
    C_Labels = [1, 1, 1, 1], C_Charsize = 1.5
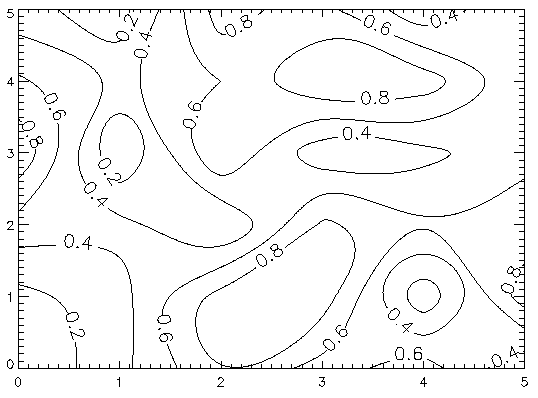
Figure 2-15 Contour plot of random data.

Figure 2-16 Contour plot of random data.
For more information, see Chapter 5, Displaying 3D Data in the in the PV-WAVE User's Guide.


