|
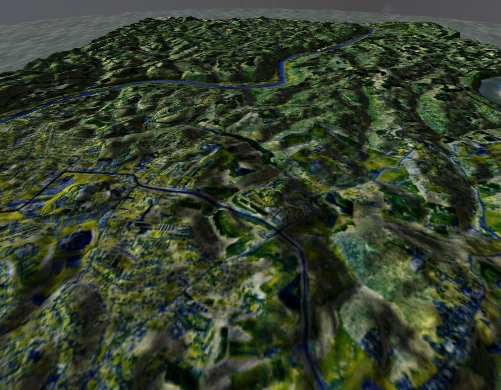
GeoView is a 3-D Visualization tool used to view geographic data in the CAVE. It allows the user to view and navigate through a digital elevation model (or DEM) that can be overlaid with a map, an aerial photo, or another texture mapping source. It was created as a Performer CAVE application and it uses version 2.2 of the Performer libraries. GeoView has been used on various projects, including the visualization of the city of Morgantown, West Virginia.(For more information on the CAVE, visit the Virginia Tech CAVE website at www.cave.vt.edu).
This website will attempt to illustrate various aspects of GeoView and explain how they are used. It will start with a look at the input file types used and how to import them into the tool. From there we will continue to controls, navigation and examples.
|
|
Table of Contents:
GeoView has two main input sources:
- A DEM.
- A texture map (aerial photo, satellite image, map)
The DEM
A DEM grid file that will be used in GeoView must be a text file with the extension .elev that contains a special header. This text file should have a total of three lines of text with a carriage return at the end of each one. The first two lines of text constitute the header of the file and give the number of columns in the first line and the number of rows in the second line. The elevation values should all be on one line of text and separated by only spaces. Also, the elevation values must be integers in order for the file to work correctly. The size of grid that can be handled by GeoView is limited to 500x500. A sample elevation file is shown below:
300
200
2463 2462 2461 2460 2457 2454 2451 2449 2446 2443 2441 2438 2436 2433 2431 2429 2428 2427 2424 2422 2421 2421 2421 2421 2421 2422 2424 2424 2424 2424 2424 2423 2422 2420 2419 2417 2415 2414 2412 2411 2410 2408 2406 2405 2404 2405 2405 2406 2407 2407 2407 2407 2406 2404 2403 2401 2400 2400 2399 2398 2396 2394 2394 2393 2393 2393 2392 2391 2392 2392 2392 2391 2390 2388 2387 2385 2383 2381 2379 2378 2376 2374 2374 2373 2373 2372 2372 2371 2371 2371 2370 2370 2370 2370 2370 2370 2370 2370 2370 2370 2371 2372 2373 2375 2376 2378 2379 2380 2380 2380 2379 2378 2378 2378 2378 2378 2379 2379 2380 2380 2381 2381 2380 2379 2379 2378 2378 2378 2378 2379 2381 2383 2385 2386 2380 2382 2385 2391 2402 2408 2409 2410 2409 2405 2395 2387 2387 2388 2391 2393 2394 2393 2393 2394 2395 2395 2395 2393 2394 2396 2396 2395 2394......etc...
|
The Texture Files
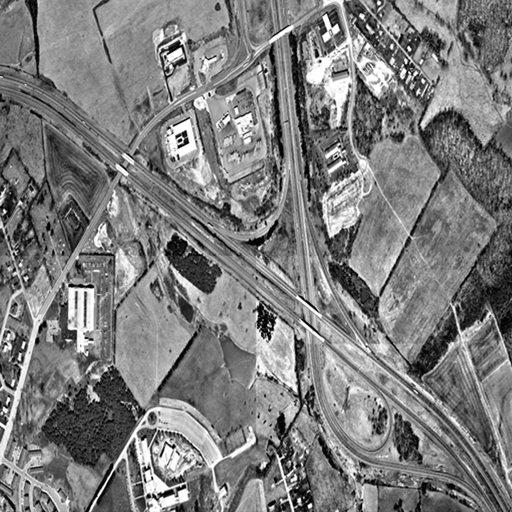
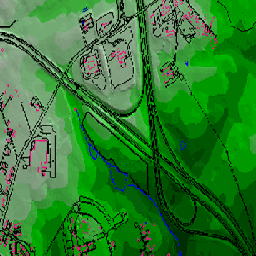
Texture files can be anything from aerial photos and maps to a graduated color map of the DEM. Maps can be used separately as an addition to the DEM with the use of one of the icons in GeoView (to be discussed in Part#3: Working with the data). Any texture file used in GeoView must be in Classic SGI Image (.rgb) format and have edge sizes equal to powers of 2 (256x256, 512x512, etc....). Even if the original image may appear compacted in one dimension, the image will still work correctly. GeoView takes the texture image and stretches it to completely cover the surface of the DEM. Therefore, if you are working with a rectangular shaped DEM, save the image as a sqaure .rgb file and it will appear correctly. The .rgb images used for the Wytheville project are shown below:
In order to bring the DEM data and the texture files into GeoView, a .config file and a .texture file must be used. The .config file is used to set specific parameters for use in Geoview. The basic format of this file and the definitions of each line are shown below (Table from Reference #3):
| map_tex (filename) |
names the texture file to use as map |
| compass (x y z) |
gives the x, y, and z location of the compass |
| icons (x y z) |
gives the x, y, and z location of the icons |
| map (x y z) |
gives the x, y, and z coordinates of the map |
| spec (value) |
gives the specular value of the surface (0-128) |
| elev_data (filename) |
names the elevation data file |
| speed (value) |
gives the maximum speed of travel |
| lod (1 2 3 4 5) |
specifies five ranges for levels of detail |
| stars (filename) |
names the texture file to use for stars |
| night_dome (filename) |
names the texture file to use for dome in night mode |
| dome_tex (filename) |
names the texture file to use for dome |
| credits (file1 file2 file3) |
names the texture files for title screen |
| cred_pos (x1 y1 z1 x2 y2 z2 x3 y3 z3) |
specifies the x, y, and z location of each title block |
The text in the table surrounded by parentheses is what the user must input to the .config file. The most important line of text in this file that must be edited to bring in new data are the map_tex line and the elev_data line. This is where the user must input the paths to the map and the elevation data file
When the .elev file is loaded, GeoView generates a series of triangles between adjacent rows which are used to form 10x10 sections with varying levels of detail. When the user is viewing the data, the sections are rendered with the appropriate level of detail depending on their distance from the viewer. The sections that are farther away are rendered in a low detail level and the sections that are close to the viewer are rendered in with the highest detail level. This reduces the rendering time required and allows for smoother motion. (See Reference #2)
The .texture file is a simple file format which tells GeoView the paths to the desired texture files. The basic format of the file is shown below (Table from Reference #3):
(number of texture files)
(Texture File 1)
(Texture File 2)
.....
.....
etc....
|
Another file that may be used to edit the look of the GeoView interface is the .icons file. This file allows the user to use different icons to switch between texture files and interact with the interface. The basic format of this file is shown below (Table from Reference #3):
(Name of Icon)
(Image 1)
(Image 2) if the icon is to change when it is clicked
(Column)
(Name of Second Icon)
(Image 1)
(Image 2) if the icon is to change when it is clicked
(Column)
etc....
|
Once these files have been modified to include the new data, the executable file ("WVdemo" for the Morgantown project) can be run to open GeoView and display the terrain model. The GeoView logo will appear in the interface. Simply click any button to procede to the data visualization.
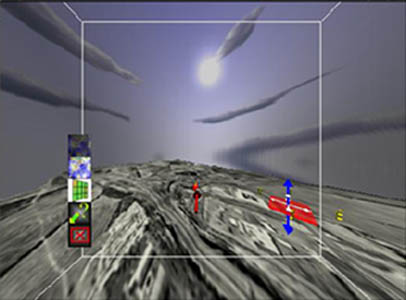
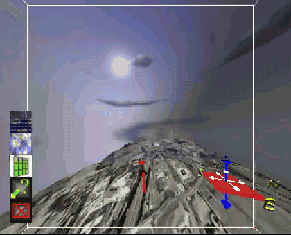
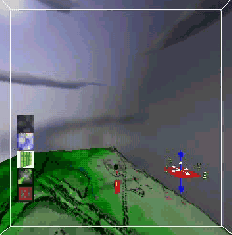
This image shows the basic interface after lauching GeoView with the Wytheville data. The black and white image has been overlaid on the DEM. The white box represents the cave walls in which the user stands.
Because GeoView is a CAVE application, it can be run in the CAVE itself or in a simulation mode. In the CAVE environment, there is a basic, white box that defines the walls of the cave in which the head can be moved around. If the box is smaller than the object(s) of interest, the box itself can be navigated through the data. Movement in the CAVE setup is controlled using a wand with a pressure-sensitive joystick pad (See Reference #2). As mentioned above in Part #3, the long axis (y-dimension) of the wand inditcates the direction of travel. The y-dimension of the pressure pad controls the user's velocity.
The wand itself has three buttons: One on the right, one in the middle and one on the left (called 1, 2 and 3 from left to right). Any of the buttons can be used to clear the title screen and bring up the data. The left button can be used in conjunction with the y-dimension of the joystich for elevator navigation. Pressing the right button and moving in the joystick's x-dimension allows the user to rotate the data. To exit GeoView, the user presses all three buttons simultaneously (See Reference #2).
The Simulator mode can be used by setting the simulator configuration option in the .cshrc file to "Yes". In this mode, the keyboard and mouse are used to navigate through the data. Below is a table showing the key and mouse combinations used for movement (See Reference #4).
| Keystroke |
Use |
| Head Controls: |
| LEFT ARROW |
Shift to the Left |
| RIGHT ARROW |
Shift to the Right |
| UP ARROW |
Move Forward in the box |
| DOWN ARROW |
Move Backward in the box |
| SHIFT + UP ARROW |
Move Up in the box |
| SHIFT + DOWN ARROW |
Move Down in the box |
| ALT + LEFT ARROW |
Rotate the head to the left |
| ALT + RIGHT ARROW |
Rotate the head to the right |
| ALT + UP ARROW |
Rotate the head up |
| ALT + DOWN ARROW |
Rotate the head down |
| P |
Reset the head and wand to intial positions |
| Wand Controls: |
| CTRL + Mouse Movement Direction |
Move wand left, right, forward, and back |
| SHIFT + Mouse Movement Direction |
Move wand left, right, up, and down |
| ALT + Mouse Movement Direction |
Rotate wand left, right, up and down |
| HOME |
Reset the wand to be in front of the user |
| F1/F2/F3, etc... |
Select Wand 1, Wand 2, etc.... |
| Box Movement Controls: |
| SPACEBAR + Mouse Position on screen |
Move Box forward and back, rotate left and right |
| SPACEBAR + Left Mouse Click + Mouse Position on screen |
Move Box up or down |
| Wand Simulator Mode Controls: |
Mouse Buttons become Wand buttons |
Screen captures, movies, and/or videos can be very useful in project presentations and lectures. The method used to create these files depends on the environment being used to view the data. In the CAVE, a scan-converter can be used that records the front wall of the cave to produce single .rgb images or videos.
In the CAVE simulator mode, the user has many options. First of all, screen captures can be taken using a special feature made to capture .rgb files. This feature outputs each frame of the simulator as .rgb files that can either be used separately or together to create a movie or animation. Another option for screen captures only is the use of ALT + PrintScreen to capture the window. This allows the user to paste the screen into an image editor or a word processor for presentation. Both movies and images can be captured using MediaCapture software that allows for capture of a window or a selected area. (The screen captures in Part #3 were created using this method.) Below are two movies that were created using MediaCapture. The first one shows the DEM with the aerial photo as the texture map. The second shows the DEM with the color GIS picture as the texture map. (These files were compressed (and converted to .avi) using Media Convert):
Created By: Marissa M. Gagne - mgagne@vt.edu
Last Updated: December 12th, 2000

