Case Study of Statistics in the Fracture of Laminated Composites
Influence of Ply Cracks on Fracture Strength of Graphite/Epoxy Laminates at 76 K
Introduction
The objective of this case study is to show how the statistical analysis of a data set must be interpreted in context with other information if meaningful conclusions are to be made by the materials researcher. Here we show that when combined with a fractographic investigation and stress analysis, results of a statistical analysis is not only more meaningful but for the materials researcher point of view such an approach can be used to verify the existence of a statistical "weak-link" effect. The objective here is to study and explain what is meant by the "weak-link" effect.
Below a visual summary is given, that is complete, but intentionally left without much explanation so that the student reading this case study can come to independent conclusions and perhaps conclusions that are different from the original researcher.
The original raw data sets are provided via hyperlinks in the figure captions were students can down load these data sets and perform an independent statistical analysis as part of their effort to explain how composite laminates fracture.
- Project Objective: to study the influence of residual stresses on zero degree ply fracture at 76 K.
- Specimens: Pulled in tension to failure: [0]8, [90]8,
[0/+45/-45/90]s ("Type-I") and [0/90/+45/-45]s ("Type-II")
graphite/epoxy laminates
- Stress Analysis: Generalized plane-strain finite-element model was used to predict stresses within the zero degree ply near ply cracks.
- Statistical analysis::Populations of fracture strengths were studied for a "weak-link"
- Fratography:Fracture surfaces and fracture events prior to fracture were investigated for a "weak-link" effect.
- References:
- R.D. Kriz and W.W. Stinchcomb, "Effects of Moisture, Residual Thermal Curing Stresses, and Mechanical Load on the Damage Development in Quasi-Isotropic Laminates," Damage in Composite Materials, ASTM STP 775, K.L. Reifsnider, Ed., American Society for Testing and Materials, 1982, pp. 63-80.
- R.D. Kriz, "Influence of Ply Cracks on Fracture Strength of Graphite/Epoxy Laminates at 76 K." Effects of Defects in Composite Materials, ASTM STP 836, American Society for Testing and Materials, 1984, pp. 250-265.
- M.P. Wnuk and R.D Kriz, "CDM Model of Damage Accumulation in Laminated Composites," International Journal of Fracture, Vol. 28, 1985, pp. 121-138.
Experimental Procedure
A total of 73 [0/+45/-45/90]s, 73 [0/90/+45/-45]s, and 70 [08] specimens were fabricated from the same batch of graphite epoxy. All specimens were 10.2 cm long with uniform width. Quasi-isotropic laminates were 1.27 cm wide and and unidirectional specimens were 0.64 cm wide. Half of the specimens of each type were exposed to 95% relative humidity at 338 K until no additional absobed moisture wight gain could be measured (WET or saturated condition). The remaining specimens were dried in an oven at 338 K until no additional moisture wight loss could be measured (DRY or dehydrated condition). Thirty-five WET and 35 DRY quasi-isotropic laminates were quasi-statically loaded in tension to fracture using a hydraulic load controlled system. A special cryogenic load fixture and extensometer , 1.27 cm gage length, were designed to load specimens in tension with causing additional loads due to thermal contraction at 76 K, Ref [2]. All specimens had glass epoxy tabs to minimize stress concentrations. All specimens were loaded in increments of 445 N, and edge replicas of damage were recorded onto acetate strips. Hence, the load increment resulting in the intiating ply cracks was recorded. All specimens were loaded to failure. All failed specimens from the four populations:
- WET: [0/+45/-45/90]s ("Type-I WET"),
- DRY: [ 0/+45/-45/90]s("Type-I WET"),
- WET: [0/90/+45/-45]s ("Type-II DRY"),
- DRY: [0/90/+45/-45]s ("Type-II DRY"),
were posted for postmortem fractorgraphic and statistical analysis and shown here in the figures below. We have also segregated specimens from the WET:[08] into four groups:
- single dominant crack,
- grip failures,
- staggered failures, and
- the more common "brooming" type of failure.
From these four groups are the fracture strengths representative of the same population or are
the four groups statistical different as their fracture surfaces would indicate.
Explanation of Visual Summary Below
Below a visual summary is given, that is complete, but intentionally left without much
explanation so that the student reading this case study can come to independent conclusions
and perhaps conclusions that are different from the original researcher. A brief explanation is
provided above for the various composite laminate types, intent of this research, a description
of the experimental procedure, and references which provide the details of this research.
These figures will also be referenced in the class lectures. Please note that raw data sets
associated with some of the figures can be downloaded via hyperlinks in the figure captions.
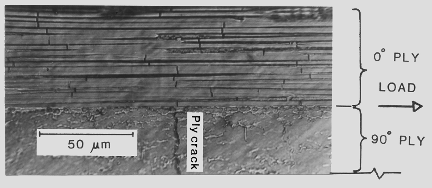
Figure 1. Edge acetate replica showing a Ply Crack and individual 0 degree fiber failures in the load bearing ply of a Type II: [0/90/+45/-45]sLaminate
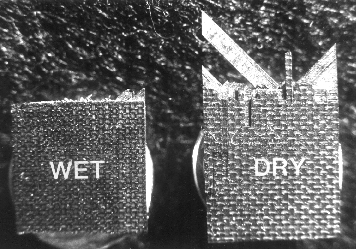
Figure 2. Comparison of representative WET and DRY fractures of [0/90/+45/-45]s
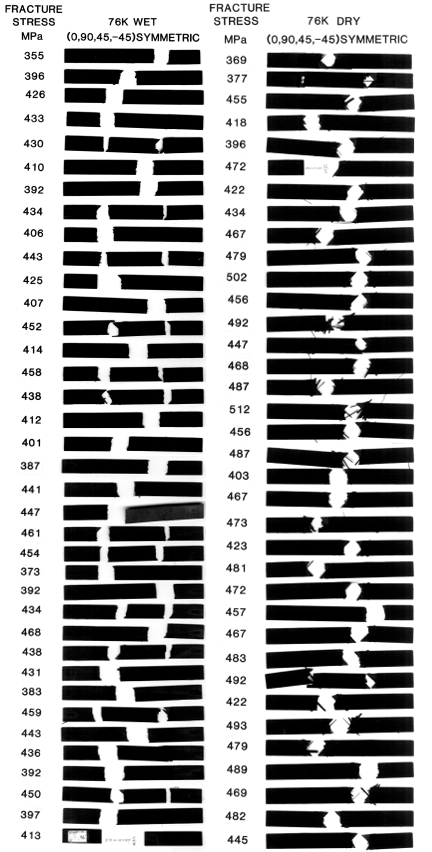
Figure 3. Comparison of entire population of
WET (IIWET.DAT) and
DRY (IIDRY.DAT)
fractures of Type II: [0/90/+45/-45]s Laminates
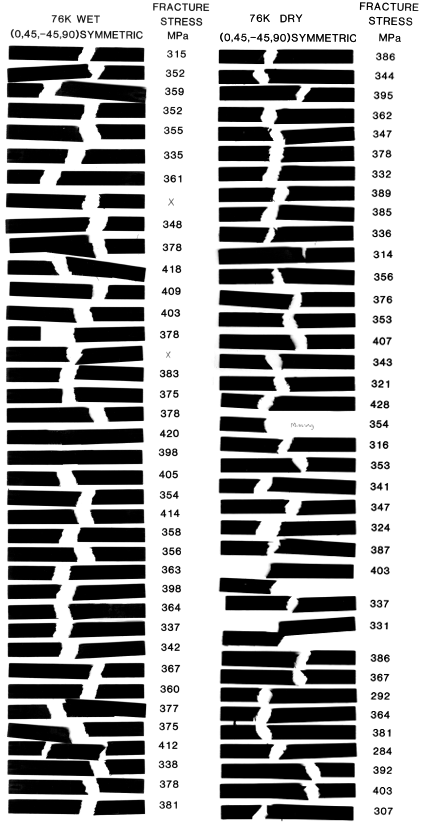
Figure 4. Comparison of entire population of
WET (IWET.DAT) and
DRY (IDRY.DAT)
fractures of Type I: [0/+45/-45/90]s Laminates
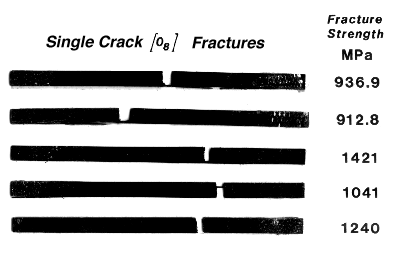
Figure 5a. Selected [08]
(O8DOM.DAT)
fracture surfaces that were unusually clean
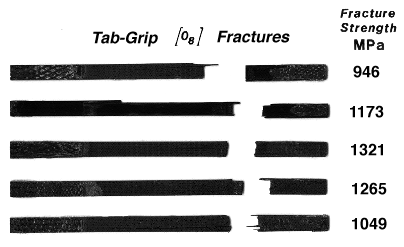
Figure 5b. Selected [08]
(O8GRIP.DAT)
fracture surfaces at or near grip
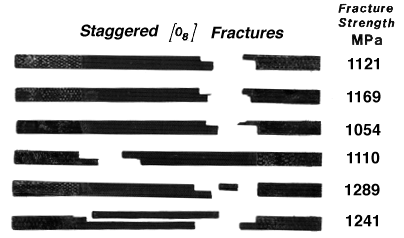
Figure 5c. Selected [08]
(O8STAG.DAT)
fracture surfaces that were staggered
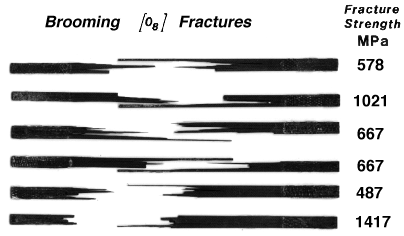
Figure 5d. Selected [08]
(O8BROM.DAT)
fracture surfaces that were "broomed" (most common)
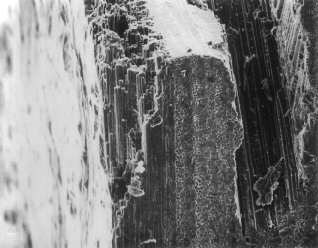
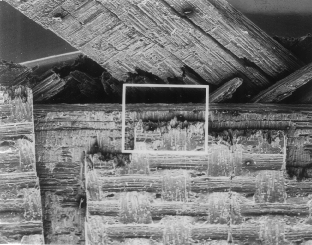
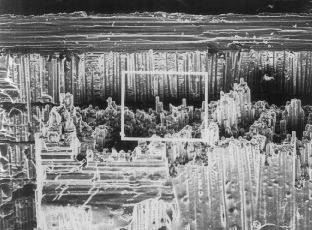
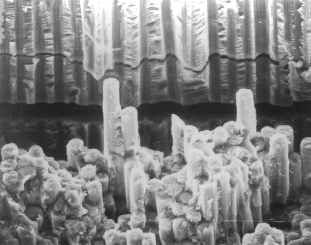
SEM Fractography
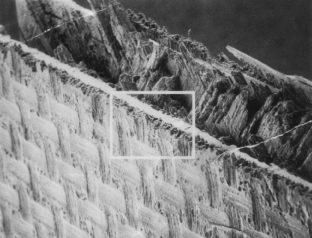
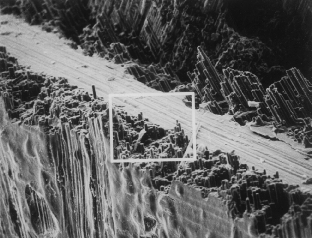
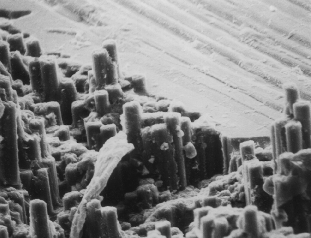
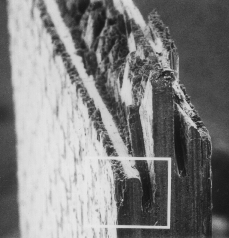
Scanning electron microscope (SEM) fractographs of fracture surfaces representative
from each population is shown below for a Type II: [0/90/+45/-45]s only.
 (a)
(a)
 (b)
(b)
 (c)
(c)
 (d)
(d)
 (e)
(e)
Figures 6 a), b), c), d), e).
Fracture surfaces of WET [0/90/+45/-45]s laminates
.
 (a)
(a)
 (b)
(b)
 (c)
(c)
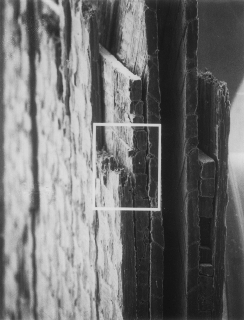 (d)
(d)
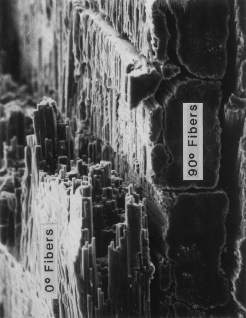 (e)
(e)
Figures 7 a), b), c), d), e).
Fracture surfaces of DRY [0/90/+45/-45]s laminates
.
Stress Analysis
Details of the stress analysis is given in Reference [2]. Here we a schematic of
the laminate and finite element mesh that was used to model a ply crack in a
[0/90/+45/-45]s laminate and the stress gradients ("concentrations") in
the load bearing 0 degree ply near the ply crack tip.
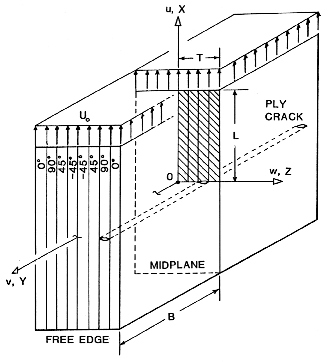
Figure 7. Schematic of Ply Crack in a [0/90/+45/-45]s laminate
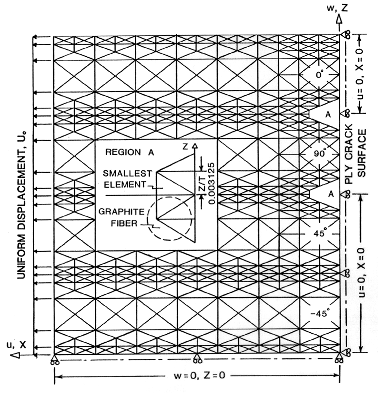
Figure 8. Ply crack finite element grid at laminate midplane.
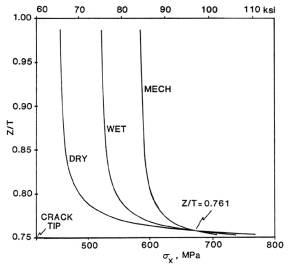
Figure 9. Mode I stress in the x-direction in the 0 degree load bearing ply above
a Ply Crack.
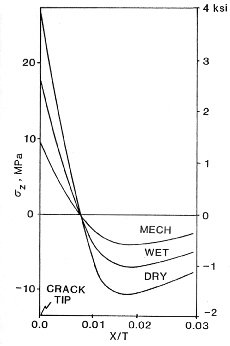
Figure 10. Mode I interface stress in the z-direction between the 0 degree and 90
degree plies next to the Ply Crack.
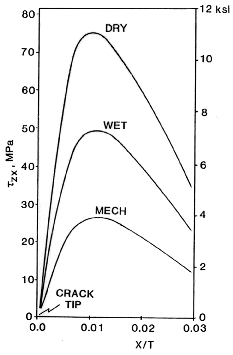
Figure 11. Mode II interface shear stress along the interface of the 0 degree and
90 degree plies next to the Ply Crack.
Statistical Results

Figure 12. Weibull plot of WET and DRY [0/90/+45/-45]s
strengths.
Analytic Models of Continuous Damage Mechanics (CDM)
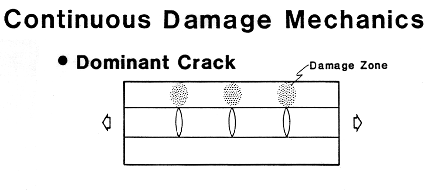
Figure 13. Formation of damage zones in 0 degree load bearing ply near Ply
Crack
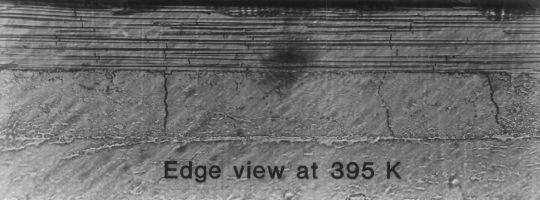
Figure 14. Edge acetate replica showing Ply Cracks and 0 degree fiber fracture
damage zones
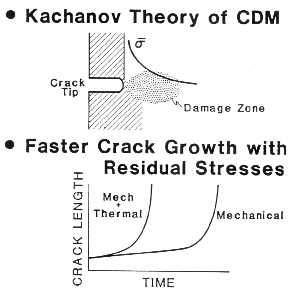
Figure 15. Kachanov Theory of CDM predicting faster crack growth when residual
thermal stress are present
Last Revised November 2020
http://www.sv.rkriz.net/class/surp/surp96/laughlin/stat/MatlExample/MatlExample.html


 (a)
(a) (b)
(b) (c)
(c) (d)
(d) (e)
(e) (a)
(a) (b)
(b) (c)
(c) (d)
(d) (e)
(e)


