 (1)
(1)The analytical methods section of the project gives a quick derivation of some necessary thermodynamic relationships to calculate temperature/composition data for a binary system. Although just deriving these equations takes ample time and effort, you also need plenty of time to solve them for your desired system.
To make the workload easier, several mathematical models and programs have been developed to calculate mountains of phase equilibrium data. Even we have written a small FORTRAN program, phase.for, to show the advantages and problems with numerical methods.
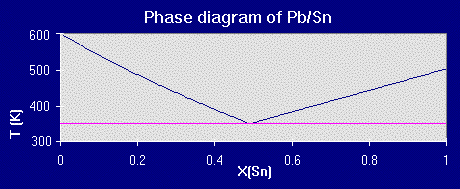
The program takes a set of data for a binary system, the standard melting points and heats of fusion for the two components A and B (readily accessible either experimentally or in thermodynamic reference tables) and generates two different sets of data. In the given lead-tin example graphs, the thermodynamic values used were Delta Hfus/Pb= 4.799 kj/mol, Tmelt/Pb= 600.45 K and Delta Hfus/Sn= 6.987 kj/mol and Tmelt/Sn= 505.06 K.
The first set of data can be plotted to see if there is a possible eutectic point. In this calculation, the components are ASSUMED to not form any compounds, to be completely soluble as liquids (and ideal solutions) and to be completely insoluble as solids. The data generated represents the freezing point of A and B vs. mole fraction of B (Xb). The freezing points can be calculating knowing that at equilibrium, the chemical potential of solid A must equal the chemical potential of liquid A (since the solids are insoluble):
 (1)
(1)
Also remembering the expression for Gibbs energy (translated here as Delta Gibbs energy of fusion) and using Delta standard entropy of fusion is the Delta standard enthalpy of fusion divided by the standard melting temperature:
 (2)
(2)
Equating the two equations and solving for T(Xi):
 (3)
(3)
Where the freezing temperature depression plots intersect is the calculated eutectic point:

Besides the solubility assumptions (the big wrench in our divergence with the actual eutectic point in the Pb/Sn example), a major problem you will run into with finding eutectic points using this method is neglecting compounds formed between the two components. Ceramic systems especially have multiple compounds since you're combining elements with sizeable electronegativity differences.
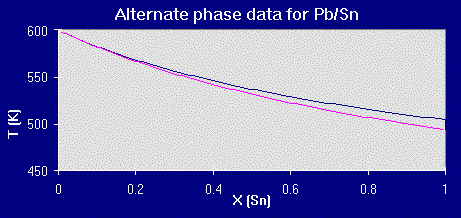
The second half of the program generates liquidus and solidus lines points using the equations derived in the analytical methods section. The solidus line is found by
 (4)
(4)
and the liquidus line by
 (5)
(5)
Plotting that data:

The actual phase diagram for the lead-tin system is in the examples and applications section.
Unfortunately, logging in lots of hours of number crunching and adding ajustment factors will not guarantee a perfect match (as well demonstrated by both sets of data). You are still only using a model, a simpler construct of reality, but the more you can recognize the restrictions inherent to or placed upon your model, the better you can utilize your predictions as a map (albeit a rough one) to help focus your work.
For example, with the data generated from the program given here, you would not immediately waste thousands of dollars in materials and manufacturing costs to make a product with the exact calculated eutectic composition, but you can be aware of the solid immiscibility and the ideality assumption and test out various compositions near the calculated point in order to hone in on the true composition (if indeed there is one!).
SO... equations and computer programs do make phase diagram work faster and simpler, but in the end, they still only give you a rough estimate.
http://www.eng.vt.edu/eng/materials/classes/MSE2094_NoteBook/
96ClassProj/experimental/program1.html