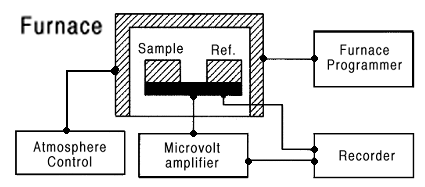
Figure 1 - Schematic diagram of a typical DTA apparatus (Wendlandt, p. 203).
In phase equilibrium determination, thermal methods of analysis are used to detect phase transitions. A change in phase involves structural changes in the material that are accompanied by evolution or absorption of heat. Thus, if a specimen is heated or cooled under uniform conditions, a structural change will be indicated by a temperature anomaly in time versus temperature data. A thermocouple is placed in thermal contact with a specimen so that the temperature of the specimen is recorded versus time either during heating or cooling. For example, when a specimen is cooled to the liquidus, latent heat is evolved as crystallization begins. This produces a thermal arrest which continues giving a constant temperature or a different slope to the time-temperature plot until crystallization is complete.
A more sensitive method is that of differential thermal analysis (DTA). In this method, a temperature difference between the specimen and a standard is determined. Thermocouples are positioned on the experimental sample and a thermal standard, each of which is kept thermally isolated from each other. The thermocouples are connected so that a differential signal is developed when a temperature difference exists between them due to a heat effect produced by a phase change in the experimental sample. The figure below shows a typical DTA apparatus.

Electrical Conductivity Measurements
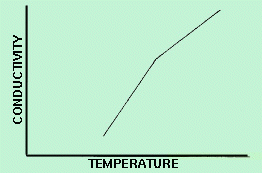
When investigating subsolidus phase equilibria, measurements of electrical conductivity have advantages over DTA, since these measurements do not require spontaneous heat effects and can thus be observed during slow rates of temperature change or upon allowance of sufficient time for equilibrium to be achieved. At subsolidus temperatures, formation of a new phase is detected by a change in slope in a conductivity versus temperature curve. In order to make electrical conductivity measurements, the specimen is electroded in a manner that assures an ohmic contact. A resistor can then be connected in series with the sample and a power source. The voltage drop across the resister is recorded simultaneously with temperature. This data is then used to construct the conductivity versus temperature curve, as shown in Figure 2.

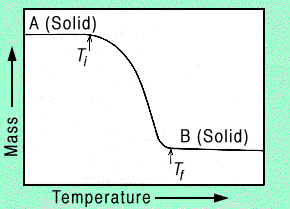
Thermogravimetry (TG) differs slightly from other thermal analysis techniques in that recorded data includes the change in sample mass as a function of temperature. The change in mass versus temperature curve provides information concerning the thermal stability and composition of the initial sample, as well as the thermal stability and composition of any intermediate compounds that may be formed. To produce this information, the sample must evolve a volatile product, which can originate by various physical or chemical processes. In a single-stage reaction, like that shown in Figure 3, two temperatures are selected off of the mass-change versus temperature curve: Ti, the inital temperature at which the cumulative mass-change reaches a magnitude that the thermobalance can detect, and Tf, the final temperature at which the cumulative mass-change first reaches its maximum value, corresponding to complete reaction.

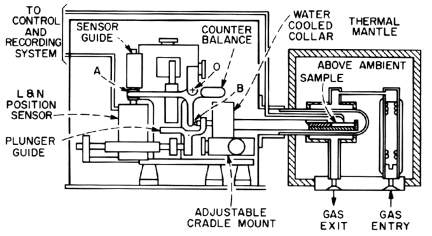
A useful technique for ceramic and glass-forming systems is dilatometry. This method uses the change in volume associated with most transitions and involves measuring the change in the dimensions of a specimen as it is heated and cooled at a fixed rate. The dilatometer (Figure 4) consists of a sensing element (transducer, variable capacitor, dial gauge, etc.) which is activated by the specimen positioned in the furnace. Changes in length of the specimen are transmitted to the sensor by means of a push rod. Note that the specimen is enclosed in a thermal mantle which is heated or cooled by passage of gas. Temperatures are measured by a thermocouple.

http://www.eng.vt.edu/eng/materials/classes/MSE2094_NoteBook/
96ClassProj/experimental/dynamic.html