Since my example problem is supposed to be an introduction to the phase diagram, its calculations, and how it is perceived, most of my text is taken from Callister.
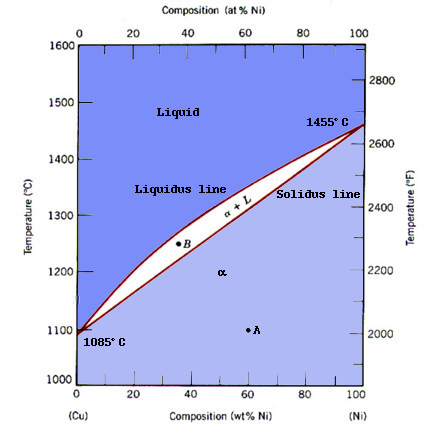
A good interpretation of a binary phase diagram that is easy to understand and interpret is the Cu-Ni system. This diagram has three different phase regions, the alpha region, the liquid region, and the alpha + liquid region, which are defined by specific compositions and temperatures as illustrated in figure 1. Both points A and B are located in the alpha and the alpha + liquid regions respectively. The phase boundaries are separated by two lines. The line separating the liquid and the alpha + liquid regions is the liquidous line. The line separating the alpha and the alpha + liquid regions is the solidous line. The intersection of these two lines signify the melting temperatures of the two constituents individually. The Cu-Ni system is especially noted for its complete liquid and solid solubility of its constituents, and is thusly identified as an isomorphous system.
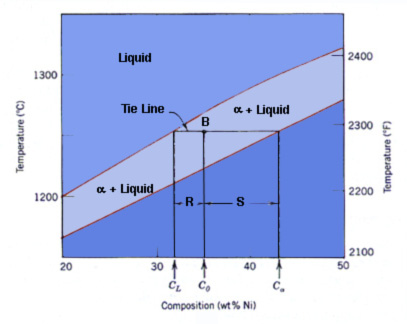
The determination of phase compositions in a single phase, is just how much of each phase is present at a given temperature. In figure 1 at point A, the alpha region is the only phase present; therefore, the composition at 1100 degrees Centigrade is a weight percent of sixty for Ni and forty for Cu. For a double phase region, the procedure intensifies. One has to first draw a horizontal line at the given temperature from the first phase boundary to the second phase boundary, which is depicted at point B in figure 2. This line is defined as the tie line. Next, at the intersection of each phase boundary with the tie line, vertical lines are drawn straight down until they intersect the x-axis where the composition of each constituent is identified. The composition of the liquid phase, CL, is 32 wt% Ni - 68 wt% Cu. Thusly, the alpha phase, CALPHA, has a composition of 43 wt% Ni - 57 wt% Cu.
Through the use of the lever rule, one can also determine the amount of each phase present. The lever rule is an expression which allows one to compute the phase amounts in a two phase alloy equilibrium situation. In a one phase region, the alloy is composed of 100% of that phase, such as the alpha region in figure 2 at point A. For a two phase region, one has to rely on the combination of the tie line and the lever rule expression.
As stated previously with the determination of phase compositions, the tie line is drawn at the specified temperature between the two-phase region and the composition of the alloy is identified (figure 2). The percentage of one phase is calculated by dividing the length of the tie line from the overall composition of the alloy to the phase boundary for the second phase by the length of the total tie line, which is denoted by subtracting the compositions of the constituents, and multiplying by one hundred. The percentage of phase two is calculated by using the same procedure.
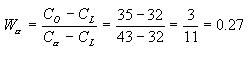
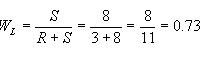
Let's take a look at computing both the alpha and the liquid phases (figure 2). The tie line is drawn at point B, which is specified at twelve hundred fifty degrees Centigrade. The overall composition of the alloy is 35 wt% Ni, the composition of the alpha phase is 43 wt% Ni, and the composition of the liquid phase is 32 wt% Ni. (It is important to note that the composition for a binary alloy needs to be specified in terms of one of the constituents.) The mass fraction for the liquid may be computed by:
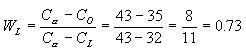
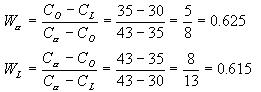
You may prefer the use of one equation over another; however, both render the same solution. The mass fraction for the alpha phase maybe computed similarly.
Again, both equations render the same solution. Conclusively, at equilibrium when both the temperature and the composition are known in a two-phase region for a binary alloy, then the lever rule may be utilized to assist in the calculations of the relative amounts or fractions of phases.
Now that an interpretation of the Cu-Ni System has been given, we need to take a deeper glance into the development of microstructure that occurs for isomorphus alloys during solidification.
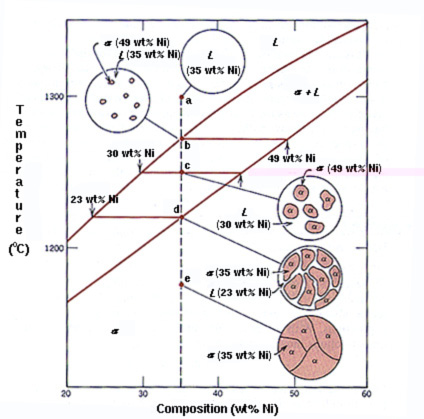
At thirteen hundred degrees Centigrade with an alloy composition of 35 wt% Ni - 65 wt% Cu, we will observe the cooling process slowly (figure 3). Equilibrium will be continuous in the given phase as long as cooling occurs very slowly. At point a, the alloy is completely liquid. This microstructure, which is represented by the circle inset in the figure, can be viewed by clicking on point a in figure 3. As the cooling process takes place, we reach the liquidous line. Here we reach a change in both the microstructure and the composition of the alloy. Point b is located roughly around twelve hundred seventy degrees Centigrade with its composition defined by the tie line. By clicking on point b in figure 3, one is able to see that the first solid (alpha) begins to form. As cooling continues from this point further, both compositions and relative amounts of each of the phases will change. With continued cooling, the fraction alpha phase will increase, as the fraction of the liquid will decrease. Its microstructure can be viewed by clicking on points c, d, and e in figure 3. It is obvious that the compositions and relative amounts of each phase will change; however, the overall alloy composition does maintain consistent at 35 wt% Ni - 65 wt% Cu.
Point c signifies that the cooling process is half complete. The microstructure displays an approximate equal amount of alpha and liquid. At point d, there is a definite increase in alpha. Very little liquid can be viewed. Finally, point e is located after crossing the solidous line. Here the remaining liquid solidifies. The outcome has a uniform 35 wt% Ni - 65 wt% Cu composition which is then a polycrystalline alpha-solid solution (point e, figure 3). If the alloy is cooled beyond point e, there will be no microstructural or compositional changes.
The solidification process is very extensive for equilibrium conditions must be maintained at all temperatures. Cooling has to take place slowly in order for the readjustments to occur in the compositions of the two phases, which will yield in the one phase diagram previously viewed. The diffusion process is the driving mechanism for the composition readjustments. Just as diffusion depends on time in order to maintain equilibrium during cooling, the composition readjustments need sufficient time.
(a.) Locate this temperature-composition point on the phase diagram (point c in figure 3). It is located within the alpha plus liquid region; therefore, both the alpha and the liquid phases will coexist.
(b) Since two phases are present, it becomes necessary to construct a tie line across the alpha plus liquid region at twelve hundred fifty degrees Centigrade, as indicated in figure 3. The composition of the alpha phase corresponds to the tie line intersection with the alpha per alpha plus liquid solvus boundary about 43 wt% Ni - 57 wt% Cu. Similarly for the liquid phase, which will have a composition of approximately 3 wt% Ni - 70 wt% Cu.
(c) Since the alloy consists of two phases, it is necessary to employ the lever rule.

There are various applications of the isomorphus Cu-Ni phase diagram that may be applied to every day experiences contained within this section.
http://www.eng.vt.edu/eng/materials/classes/MSE2094_NoteBook/
96ClassProj/examples/cu-ni.html