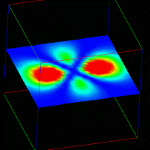
As with the isosurface example, the dataset is the probability density for finding an electron in a d0 hydrogen orbital. The hydrogen orbital dataset is in "fields/hydrogen.fld" from the default starting directory for the read field module.
(click here to download the network)


|
This network can easily be combined with the isosurface network to produce a composite visualization. Just grab an isosurface module and connect it into the network. |
(click here to download the network)

