 The array for which the density function will be computed. The size of each dimension of array may be any integer value.
Returns the density function of an array.
The array for which the density function will be computed. The size of each dimension of array may be any integer value.
A longword vector equal to the density function of the input array.
An array of the maximum values to consider for each image or signal in array. If Armax is a single element array, Armax(0) is used for every image or signal. For a multi-image or multi-signal input array, Armax must contain the same number of elements as there are images or signals in array.
NOTE: When both Armin and Armax are supplied, they must contain the same number of elements.
An array of the minimum values to consider for each image or signal in array. If Armin is a single element array, Armin(0) is used for every image or signal. For a multi-image or multi-signal input array, Armin must contain the same number of elements as there are images or signals in the input array. Binsize
The range of values to consider as having a single value. If no value is specified, the Binsize range defaults to a value of 1.Intleave
A scalar string indicating the type of interleaving of 2D input signals containing signal-interleaved signals; and 3D input arrays containing image-interleaved images, or a volume. Valid strings and the corresponding interleaving methods are:
'signal' The 2D input image array arrangement is (x, p) for p signal-interleaved signals of length x.
'image' The 3D image array arrangement is (x, y, p) for p image-interleaved images of x-by-y.
'volume' The input image array is treated as a single entity.
The maximum value to consider. If set but no value is specified, array is searched for its largest value. If the Max keyword is specified, its value is used for every signal or image in the array. Min
The minimum value to consider. If set but no value is specified and array is a byte data type, the value 0 is used; otherwise, array is searched for its smallest value. If the Min keyword is specified, its value is used for every signal or image in the array.Omax
Specifies a variable used to hold the maximum value considered in the array. (Equal to max when the Max keyword is given.) If the input array is composed of multiple images or signals, Omax is an array of the maximum values, one for each signal or image. (Equal to max or armax when Max or Armax is given.)Omin
Specifies a variable to hold the minimum value considered in the array. (Equal to min when Min is given.) If the input array is composed of multiple images or signals, Omin will be an array of the minimum values, one for each signal or image. (Equal to min or armin when Min or Armin is given.)
In the simplest case (in which array ranges in value from 0 to some maximum value), the value of the density function at subscript i is equal to the number of array elements with a value of i.
For example, let Fi equal the value of element i, for i in the range {0 ... n-1}. Then Hv (the result of the HISTOGRAM function) is given by:

.
NOTE: There may not always be enough virtual memory available to create density functions of arrays that contain a large number of bins. For information on virtual memory and PV-WAVE, see Chapter 11, Tips for Efficient Programming in the PV-WAVE Programmer's Guide
Histograms can also be used to provide clues about images. For example, running a histogram on a series of identical photos taken at different times of the day may show the histogram peak shifting to the right
an indication that the average brightness is higher in that photo, and therefore more likely to be have been taken at a sunnier part of the day.Similarly, you can use histograms to compare two images of the same scene more fairly. By shifting the histogram of one scene so that it is aligned with that of the other scene, you can equalize the level of brightness in both images.
x = [0.77, 1.74, 0.81, 1.20, 1.95, 1.20,  $
    0.47, 1.43, 3.37, 2.20, 3.00, 3.09, 1.51, $
    2.10, 0.52, 1.62, 1.31, 0.32, 0.59, 0.81, $$
    2.81, 1.87, 1.18, 1.35, 4.75, 2.48, 0.96, $
    1.89, 0.90, 2.05]
table = HISTOGRAM(x, Binsize = 0.444)
PRINT, '   Bin Number    Count' &$
PRINT, '   ----------    -----' &$
FOR i = 1, 10 DO PRINT, i, table(i-1)
Bin Number    Count
----------    -----
     1           4
     2           8
     3           5
     4           5
     5           3
     6           1
     7           3
     8           0
     9           0
     10                   1
OPENR, unit, FILEPATH('whirlpool.img',  $
    Subdir = 'data'), /Get_Lun
; Open the file containing the galaxy image.
g = BYTARR(512, 512)
; Create an array large enough to hold the image.
READU, unit, g
; Read the image.
FREE_LUN, unit
; Close the file and free the file unit number.
!Order = 1
WINDOW, 0, Xsize = 512, Ysize = 512
; Create a window with the same dimensions as the image.
TVSCL, g
; Display the original image.
Figure 2-43 Original galaxy image.
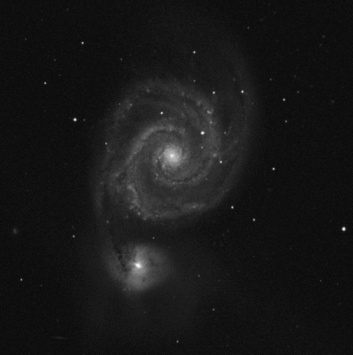
Figure 2-44 Original galaxy image.
hist_g = HISTOGRAM(g)
WINDOW, 1, Xsize = 512, Ysize = 512
PLOT, hist_g, Xrange = [20, 100],  $
    Yrange = [0, 30000], Title =  $
    'Density Function of Original Image'
Figure 2-45 Plot of density function of original galaxy image.
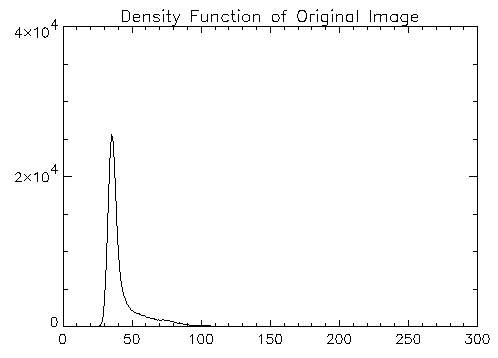
Figure 2-46 Plot of density function of original galaxy image.
g2 = HIST_EQUAL(g)
WINDOW, 2, Xsize = 512, Ysize = 512
TVSCL, g2
Figure 2-47 Histogram equalized galaxy image.
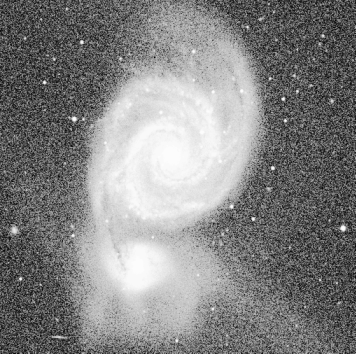
Figure 2-48 Histogram equalized galaxy image.
hist_g2 = HISTOGRAM(g2)
WINDOW, 3, Xsize = 512, Ysize = 512
PLOT, hist_g2, Xrange = [20, 100],  $
    Yrange = [0, 30000], Title =  $
    'Density Function of Equalized Image'
Figure 2-49 Plot of density function of equalized galaxy image.
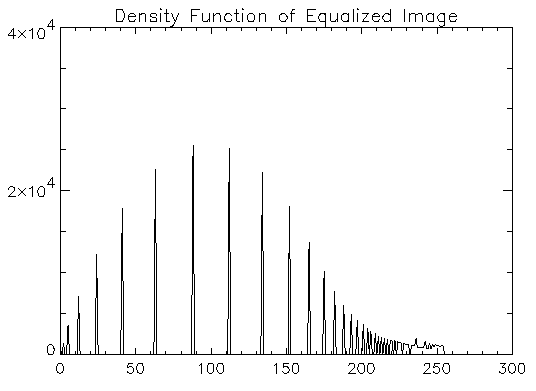
Figure 2-50 Plot of density function of equalized galaxy image.

