This project is part of the 1996 Scientific Visual Data Analysis and Multimedia class, ESM Department, Virginia Tech.
The project is divided into 6 sections: Local theory, Limit cycles , Hopf bifurcations , Attracting sets, Strange Attractors, and Transient behaviour. Each of these sections discribes some of nonlinear differential equation features.
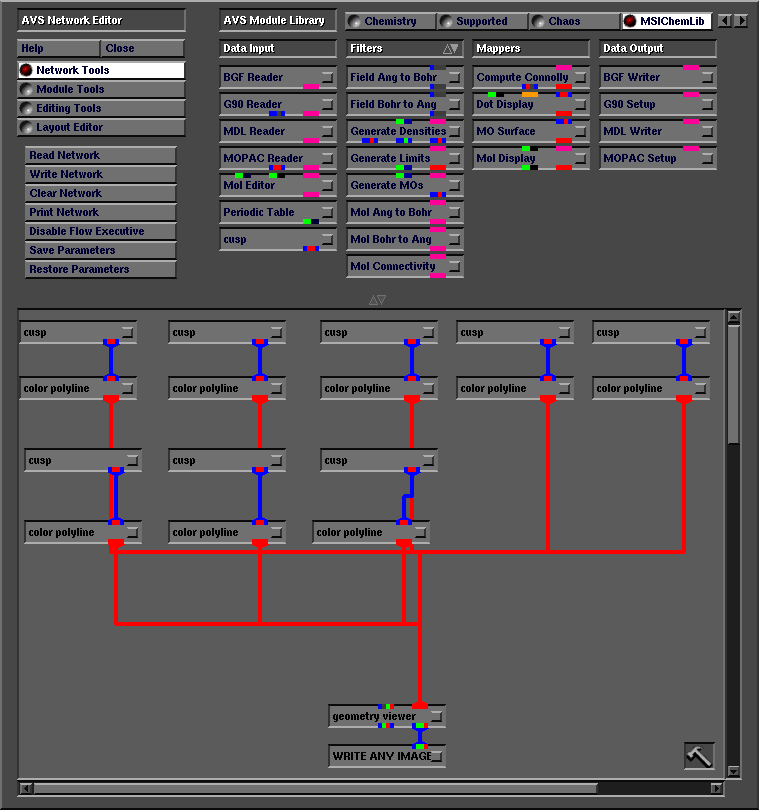
The front page of the project lets the user choose his favorite layout (three options are offered). The page is devided into frames. One of the frames is used to visualize pictures and animations. Another frame is assigned to displaying text and reduced pictures. Each time you click on a pisture, a more detailed picture or an animation pop up in the picture window. Pictures and animations have been generated using avs. Here is an image of the network editor of AVS:
Animations have been created using Gifbuilder, freeware available on the net. Animations are made of multiple gif files, that Netscape is able too read and animate. These files are not as interactive as Java applications, but they have the advantage to be faster to download and play.
Here is a snapshot of the Gifbuilder interface. If you click on it, you will be a demo of the software (pictures dowloaded from the Gifbuilder web site).

How to read the images: the blue color indicate points that are close to the original one (with respect to time), then come green points, and red points at last. This may be useful to understand the direction of the soltution, whether it is converging or not...
Netscape has had some problems with reloading the files lately (version 2.0). They are workin on fixing this bug, but sometimes files may not reload properly. Since this page is using animated gif files, you may experience some troubles viewing the animations. What may happen is that the animation will loop only once. This will happen for sure if you set your cache memory to zero.