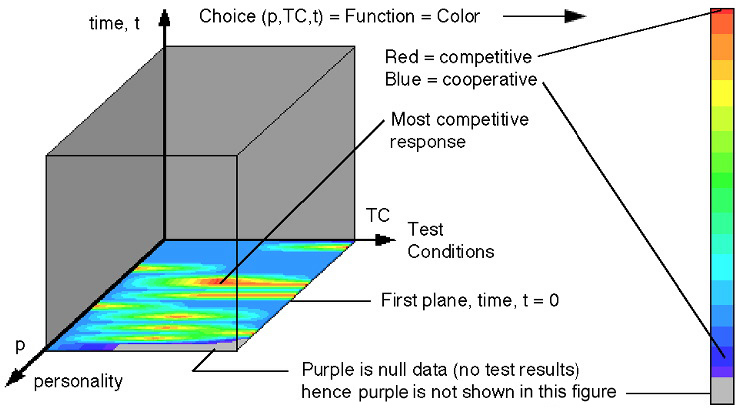
Figure 11. Compressed psychological experimental data
The first example is an experimental data set generated by Dr. Bill Lawless a psychologist at Paine College in Augusta Georgia. The objective was to generate a data set that would allow a psychologist to select 5 AirForce pilots out of 20 that would constitute the best possible of all combinations for a particular mission. The selection is made by testing all 20 prospective pilots under three test conditions over a ten day period. The selection is made by monitoring pilots choices to the test conditions. Hence, choice, C, becomes a function of pilot's personality, p, test condition, TC, and time, t.
Function: C = C( p, TC, t ) (2)
Following the previously defined visual data compression method, we avoid drawing the family-of-curves figures and immediately draw the final compressed format shown in the schematic figure, Fig. 11, shown below.
Figure 11. Compressed psychological experimental data
Because this is an experimental data set, we want to avoid eliminating data until we can make a comparison. From our recently defined visual method we can indeed postpone eliminating any data until we view it all at once. Hence our conclusions are based on observing all the data first. With this method the observer can also find unexpected trends in the data, which is similar to the analytic example shown in Fig. 5. These two tasks: viewing all data and looking for trends, could only be accomplished by a method that does not require data reduction or simplification of data a priori.
There are several interesting aspects of this data set that are quite different from the previous analytic data set defined in equation (1). Except for time there is no particular ordering of data along the personality or test condition axes: parameters along axes do not have to be continuous. Stretching data along the TC axis allows the viewer to compare results. For null test results we can simply use transparency similar to that used in Fig. 6 where we are not required to use a particular color. Indeed for the null data we are not cognitively required to process "see" data as a particular color and then required to make a mental effort to disregard that color. Recall Tufte's examples on "chart junk" [1]. A well designed interface is not seen. In this example the viewer is not required to view purple, hence, the viewer's efforts focus only on relevant data. This part of the data interface literally becomes transparent.
Results are shown in Fig. 12 where the following interactive investigative process is summarized. In the bottom plane of Fig. 12a we observe the initial distribution of competitive and cooperative choices. If we move the bottom plane up in time we observe how each personality in a comparative format changed their choice with time. A revealing observation in one plane often directs the observer to select and move another plane perpendicular (orthogonal) to the first. For example in Fig. 12a we move a vertical plane over the most competitive personality and observe that this individual became cooperative in Fig. 12b. This raises the question whether similar trends can be observed for other personalities. Hence, we move a third orthogonal plane over all competitive responses and find one individual who maintains a competitive response in Fig. 12c. A fourth plane is moved to that region in Fig. 12c and shows that this individual is competitive only for that one test condition, Fig. 12d.
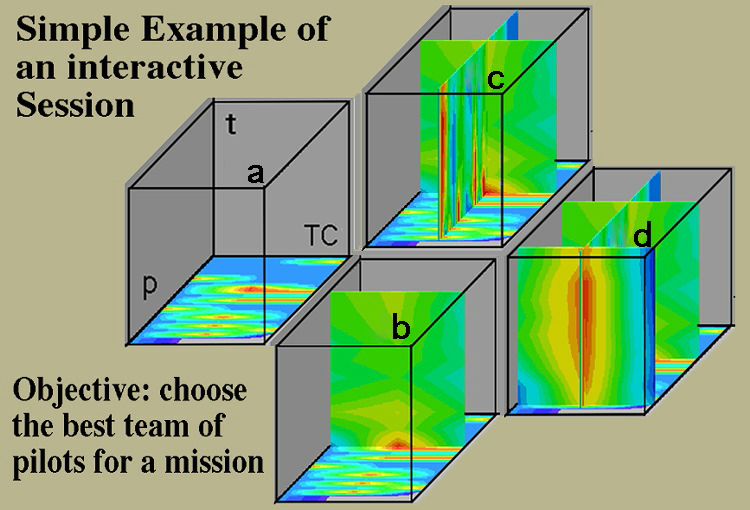
Figure 12. Simple example of an interactive session.
To make the same observations and interact with the data in a family-of-curves format would be impossible. We recall in Tufte's example of "from tables to graphs" that accuracy in data is not a requirement when observing and comparing functions. The desired function can be more accurately selected from the graphs than from the tables. Accurate data should not be confused with making an accurate selection from what could be a confusing array of functions. From studying this experimental data set we conclude that the observer can make a quick decision with high confidence because all measured data were observed in a comparative-interactive-compressed format. In general this method should work well when massive data sets are constantly changing and decisions are based on the existence of functions embedded within this data.
Original: http://www.sv.vt.edu/classes/ESM4714/methods/Pilots.html
Current: http://www.sv.rkriz.net/classes/ESM4714/methods/Pilots.html